

CoreLogic HVI Report, Quarterly Rental Review

Thank You, Tim Lawless and Eliza Owens CoreLogic Australia, for sharing the HVI and Quarterly Rental Review with us. Here are the key takeaways;
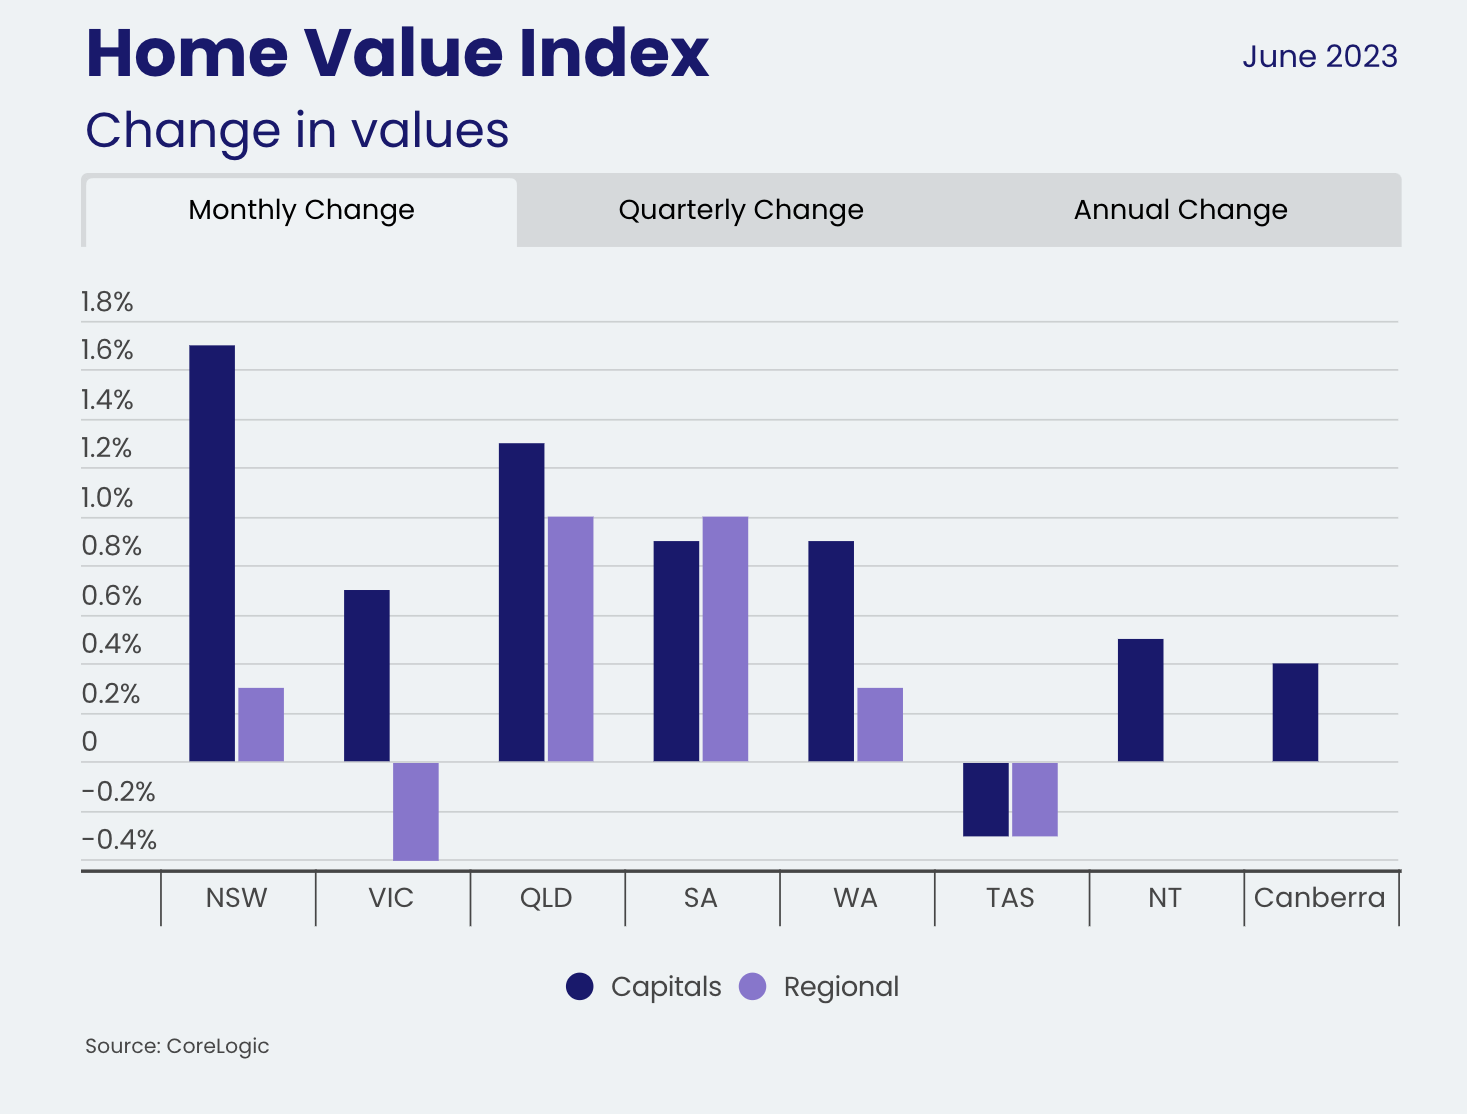
Fourth Month of increases with Sydney leading the way, all other capital cities recording a positive except for Hobart.
Perth peaked in June 2023, REG WA and SA at currently at a cynical peak.
Historically low stock levels, -26.4%, meaning the market has shifted to a vendors market.
National Auction Clearance Rates average above 70%
Net migration anticipated at 400,000 puts pressure on rental markets
New construction completions slightly ease rental availability from 1.1% to 1.2%.
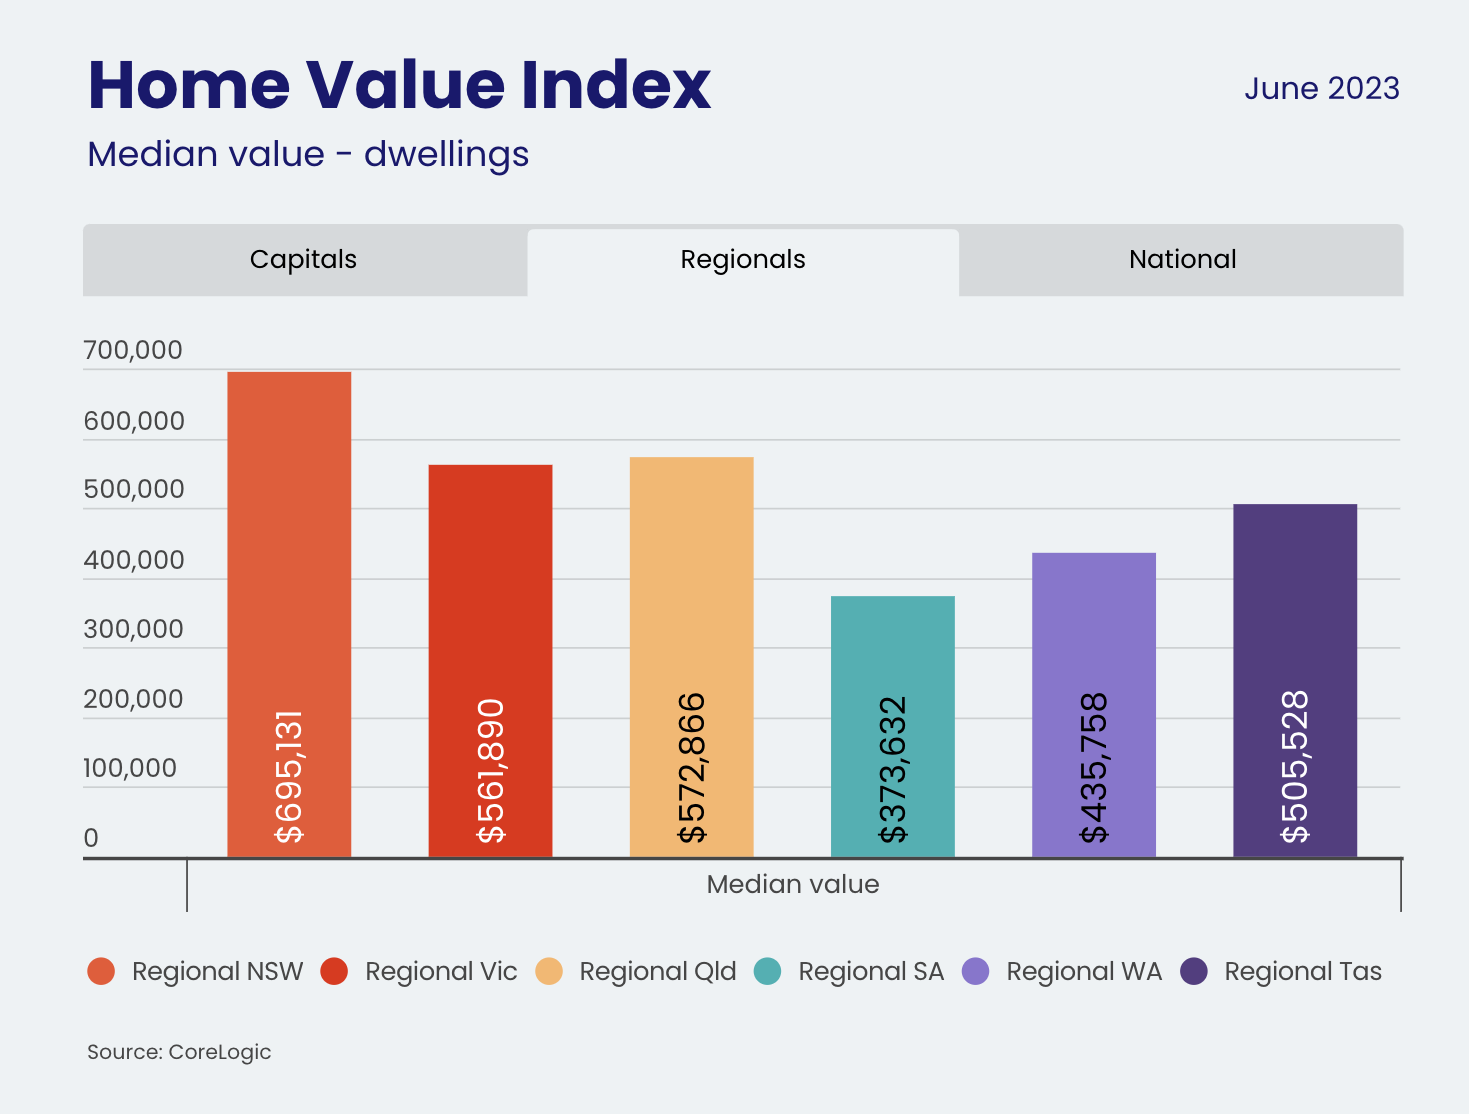
Australia’s Housing Market has moved through its fourth Month of increases in Home Value Index (HVI), with all Capitals rebounding except for Hobart, which recorded a marginal loss of -0.3%, with regional Tasmania also recording -0.3%, and Regional Victoria recording the largest negative of -0.4%.
The stand-out capitals for the month were Sydney, with another strong increase of +1.7%, and Brisbane recording +1.3%. The strongest regions were Regional Queensland and Regional South Australia, recording +1.0% with REG SA at its cynical high with REG WA.
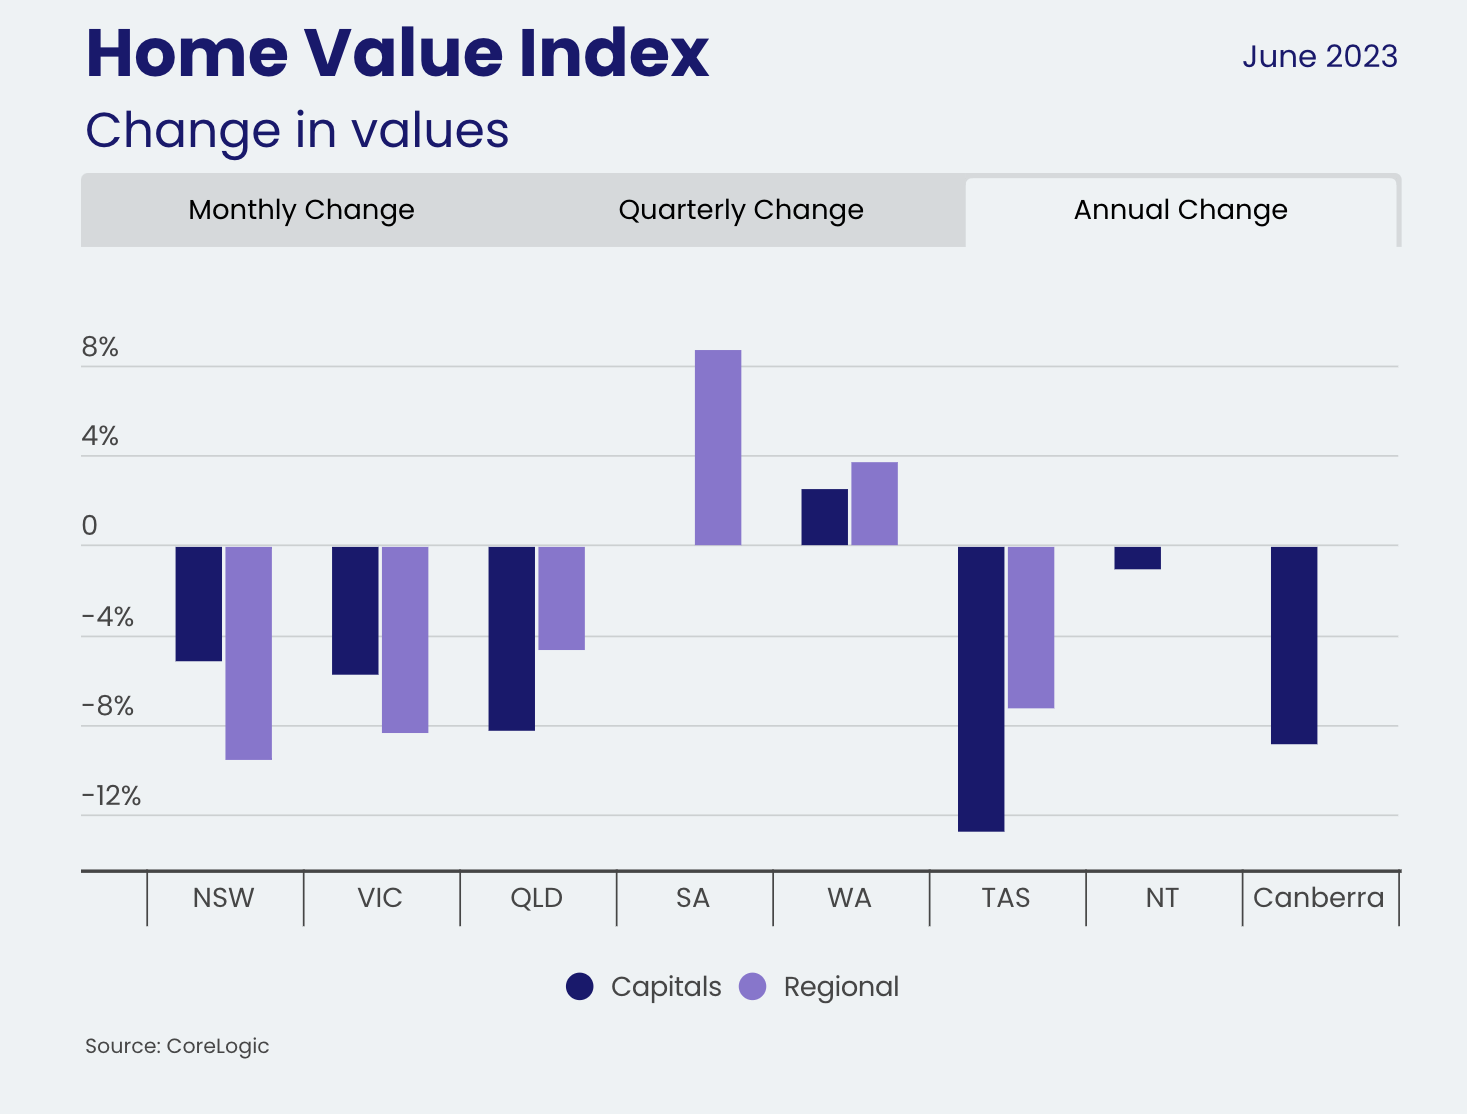
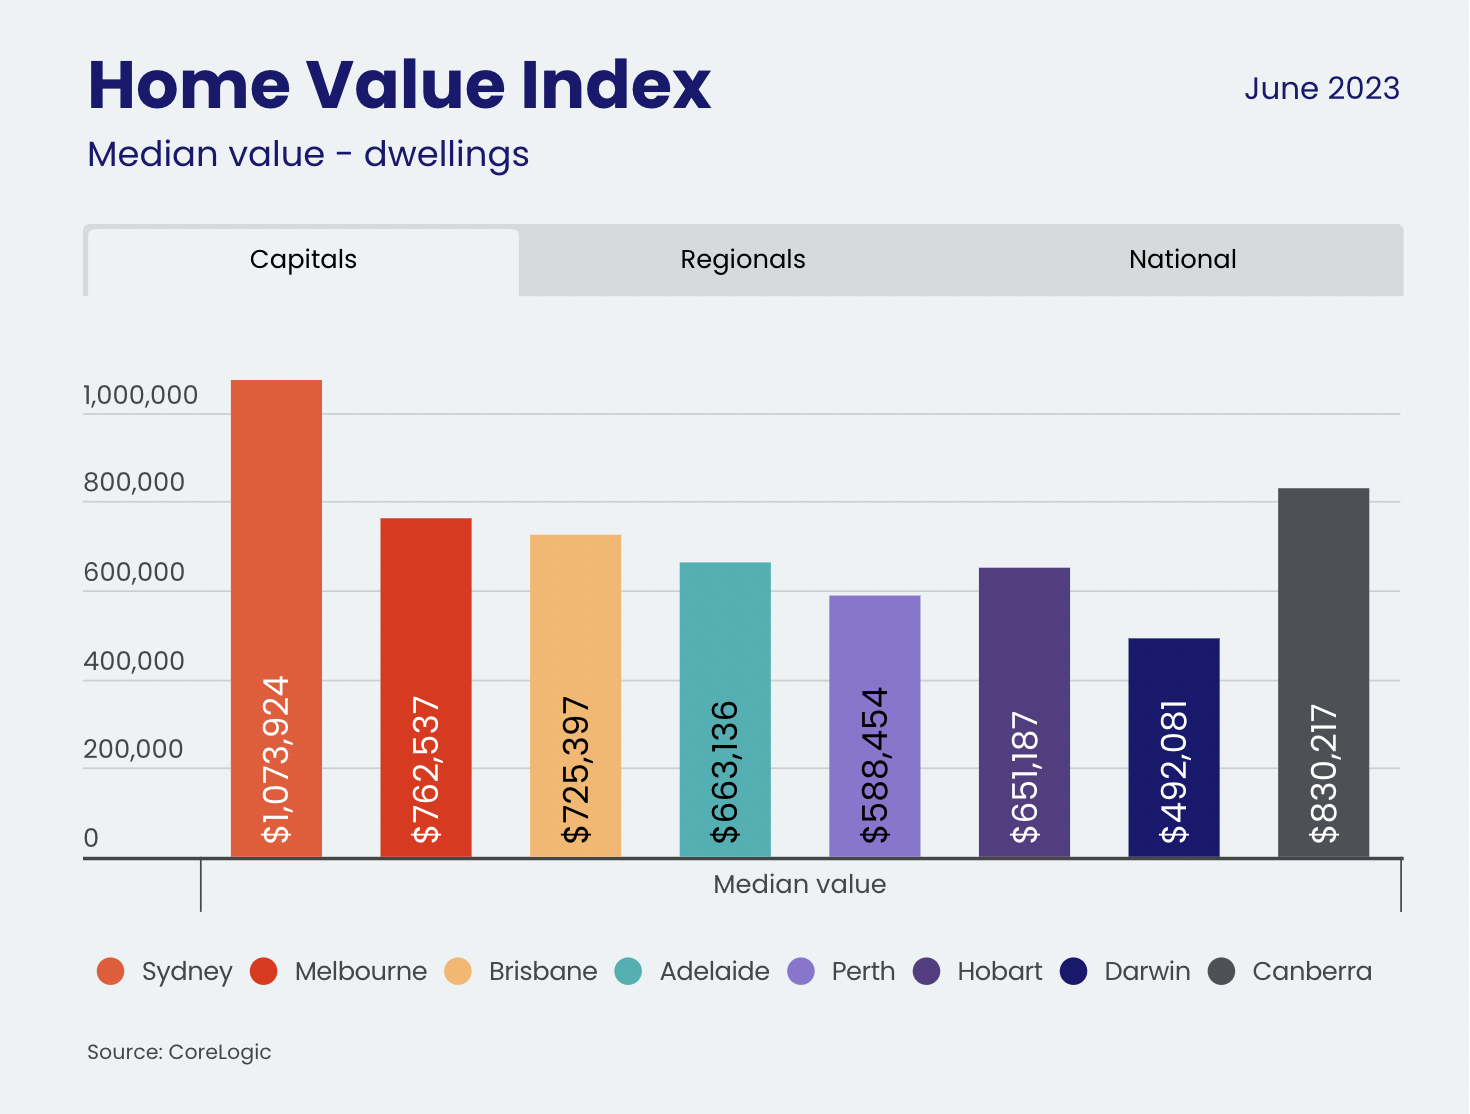
Sydney remains the most expensive Capital City, with its HVI rebounding strongly in the year to date of +5.3%. The strongest performer in the regionals is SA, recording 4.9% year to date and 8.7% annual.
Not all capital cities and regional areas are equal.
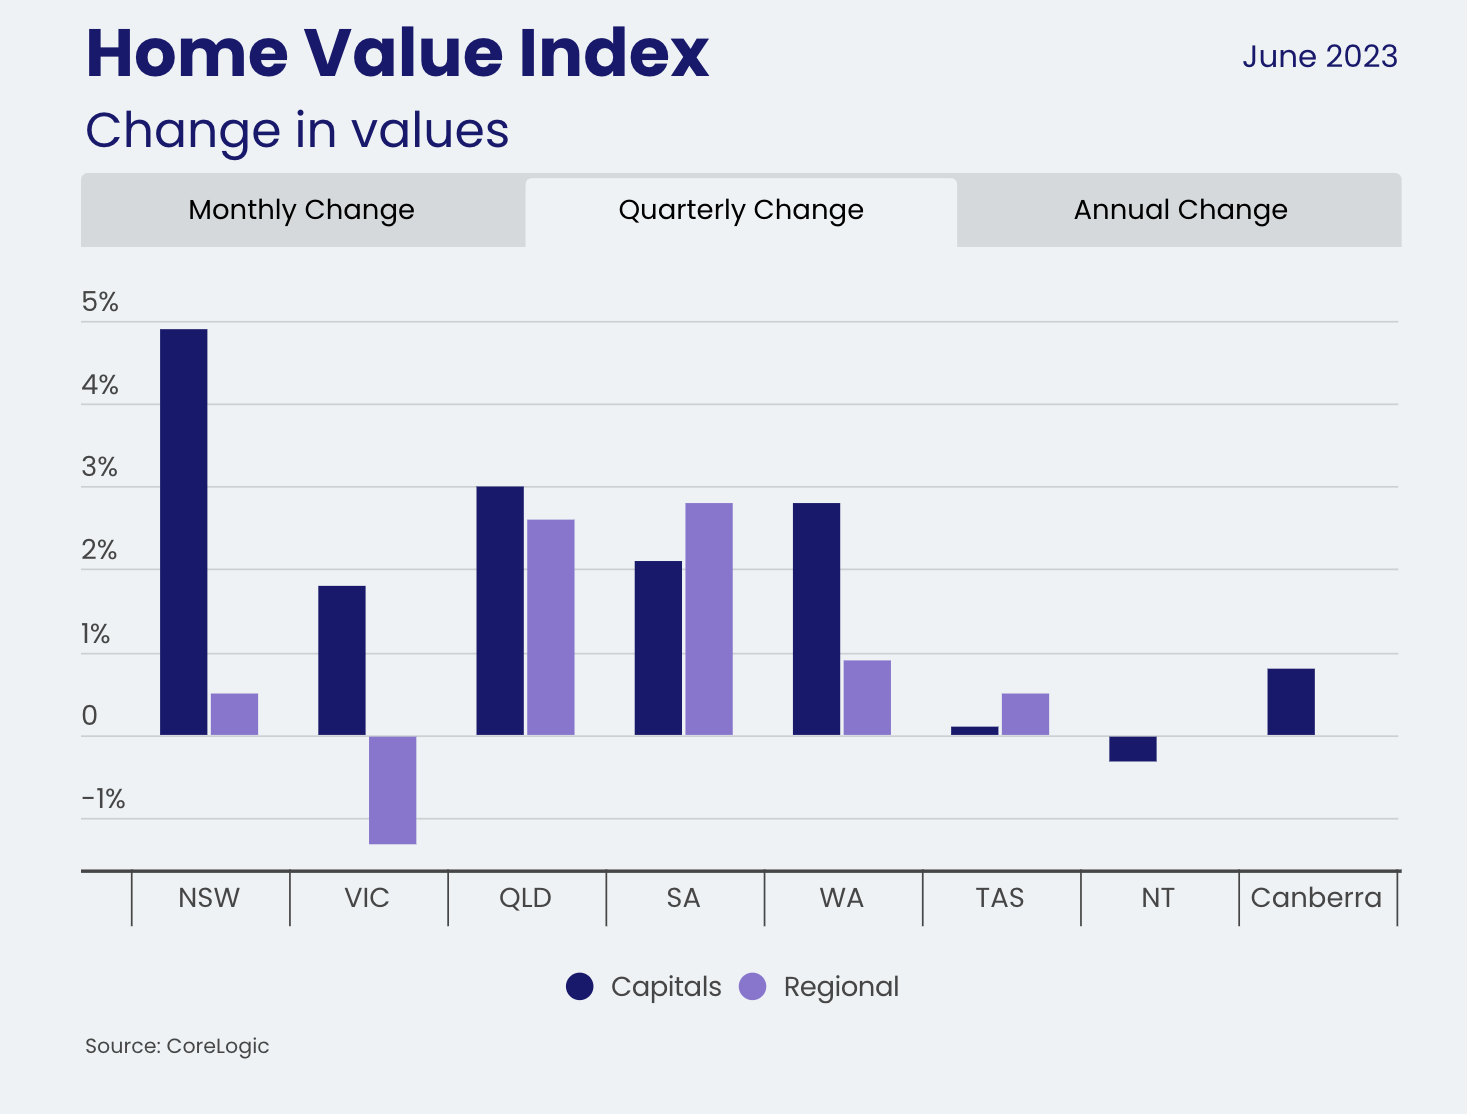
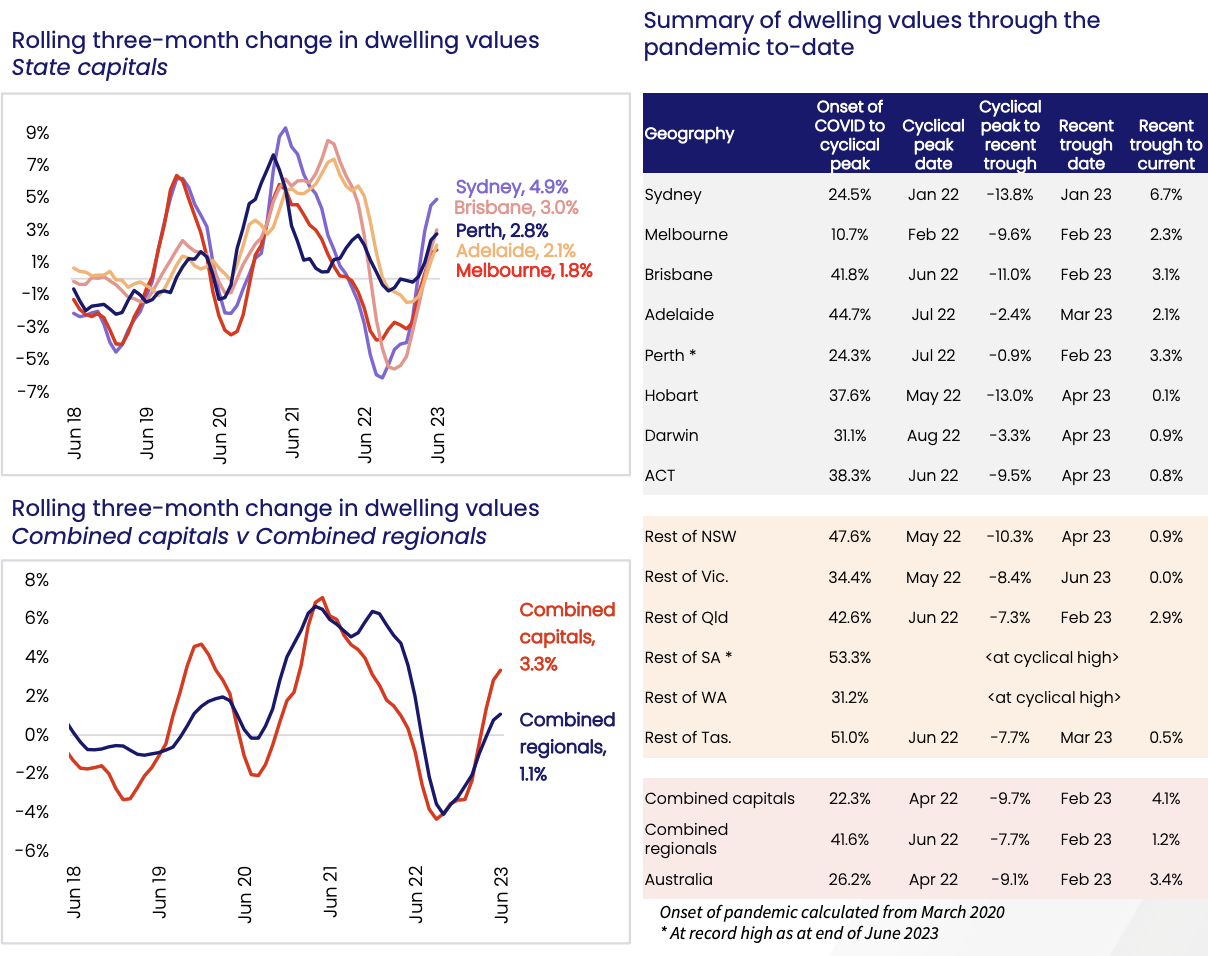
The three-month rolling changes see Sydney leading the way + 4.9%, followed by Brisbane +3.0%, Perth* (Peak in June 2023) +2.8%, Adelaide +2.1% and Melbourne +1.8%. Adelaide had weathered the Covid Peaks and troughs with the least losses, only losing -2.4% after making an incredible +44.7%. Sydney has rebounded the strongest, recording +6.7% since its trough of -13.8% (down -7.1% from its peak); Brisbane lost -11.0% yet has since recovered +3.1% (down 8% from its peak). The smallest rebounding capital cities are ACT, +0.8% rebound from its -9.5% (down -8.7%) and Hobart, 0.1% from its trough of -13% (down -12.9%)
Perth is recording its record high in June 2023, +24.3%, and REG SA, +53.3% and REG WA, +31.2%, are currently at the cyclical high.
“The market has be buoyed by the lack of supply. Buyers simply don’t need to sell unless they have too. The imbalance between supply and demand has seen selling conditions turn in favour of vendors rather than buyers.”
Source: CoreLogic Australia HVI Report June.
“Auction clearance rates across the combined capitals held in the high 60% range through June, in stark contrast to late last year when clearance rates were generally below 60%. Outside of auction markets, vendors have become less flexible on their price expectations, with capital city discounting rates tightening from -4.3% late last year to -3.6% in June,” Mr Lawless said.
Source: CoreLogic Australia HVI Report June.
The latest week’s Auction Clearance Rates recorded after the recent RBA decisions to hold interest rates saw the national average above 70%.
With the current tightening of the monetary markets with the Reserve Bank of Australia raising interest rates 12 out of 14 times since May 2022, putting pressure on the serviceability of new home loans. There may be more pain in the market as owners move from historically low fixed rates to variable rates. Many owners may not meet the serviceability requirements to refinance their loans and may be forced to sell their properties if they did not plan ahead for an interest rate increase of 4%.
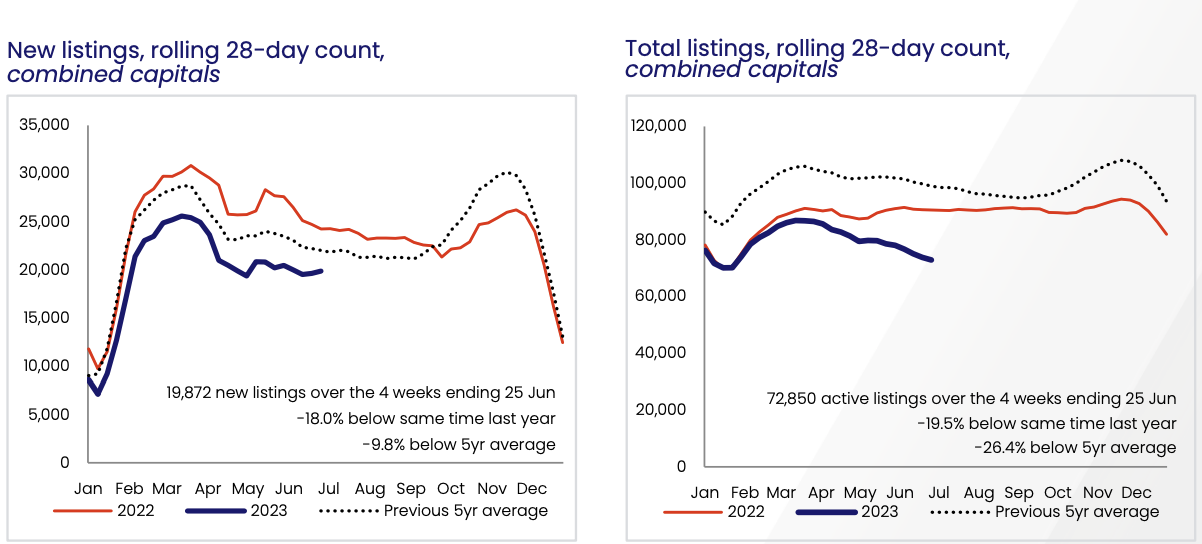
Currently new stock is down -18% since 2022, and -9.8% from it’s five year average. Overall stock levels are down -26.4% on the five year average and -19.5% below the same time last years figures.

The rolling quarterly’s three month average sees the market returning to the previous 5 year average for the capital cities and double dipping below the 5 year average for regional areas.

There is good news for investors, with net migration returning, Eliza Owens says,
“Net overseas migration was forecast to reach 400,000 people this financial year just past, and stay elevated for the foreseeable future, which is expected to create ongoing demand for Australian housing and place renewed pressure on demand for new dwellings down the track.”
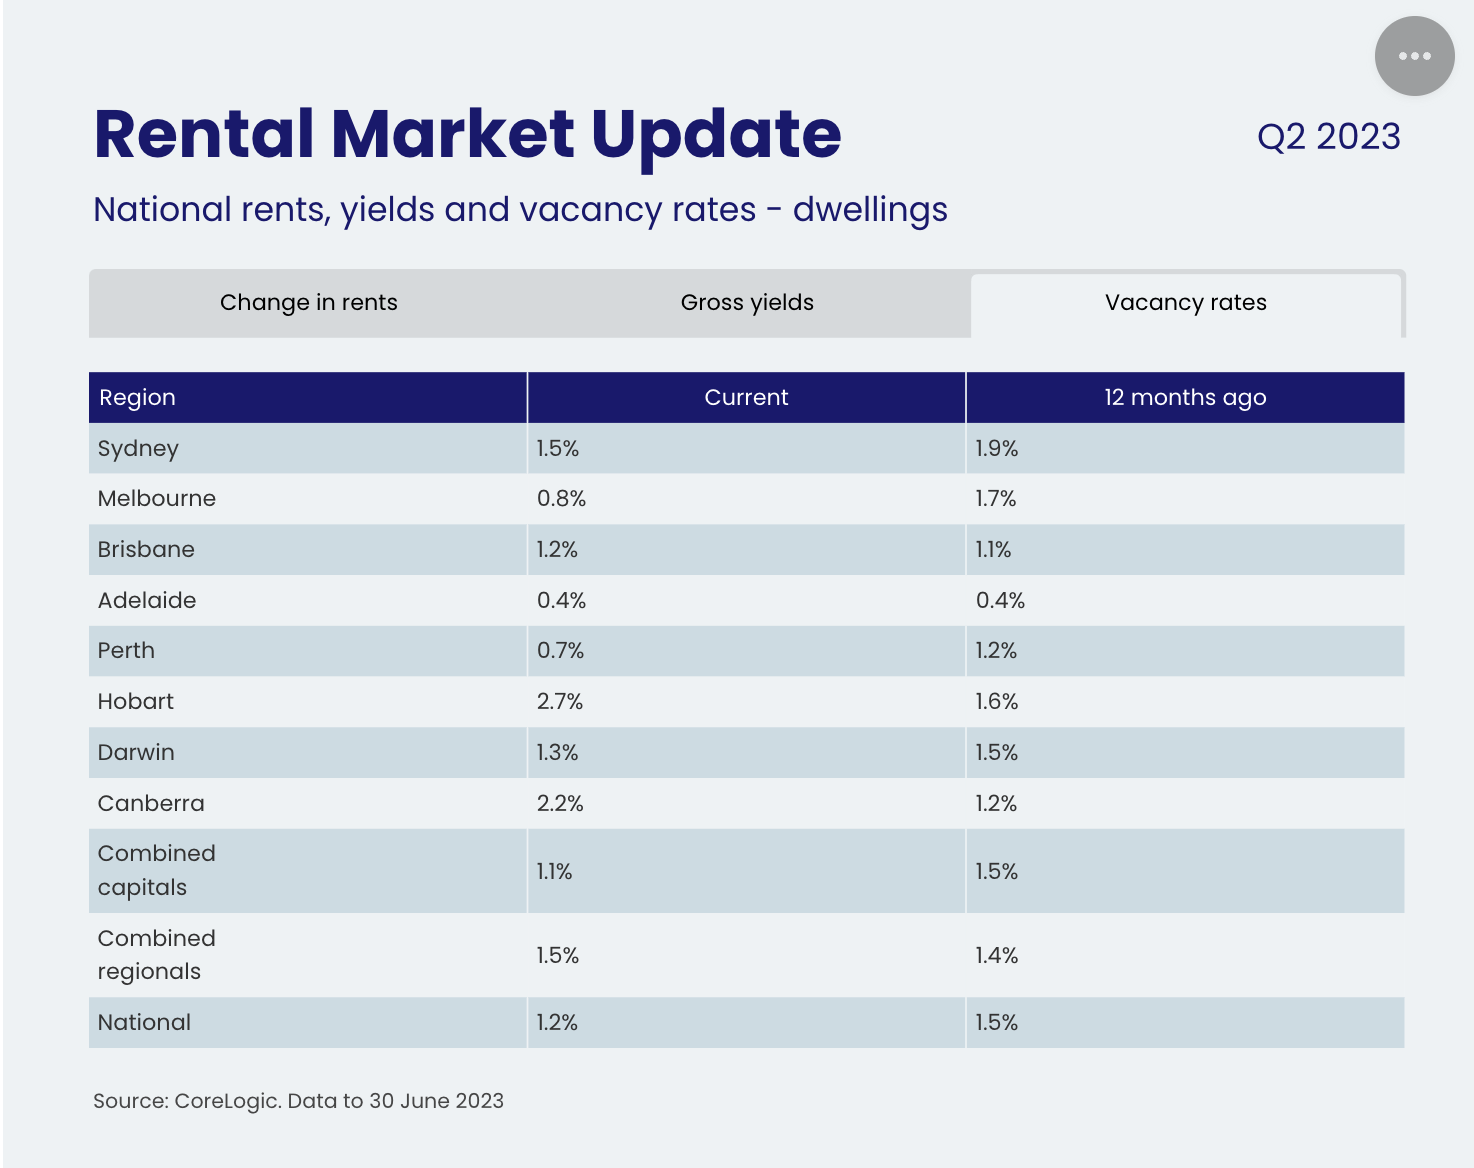
The massive shortfall in rental listings means that supply is well below the previous five-year average, with a national shortfall of approximately -32.4% or 47,500 rental listings recorded over the four weeks to June 3rd.
Despite the continued shortage in listings, national vacancy rates eased slightly over the quarter as new dwellings came onto the market. The June quarter recorded a 1.1% in March, to 1.2% in June, but remained well below the pre-COVID decade average of 3.3%.
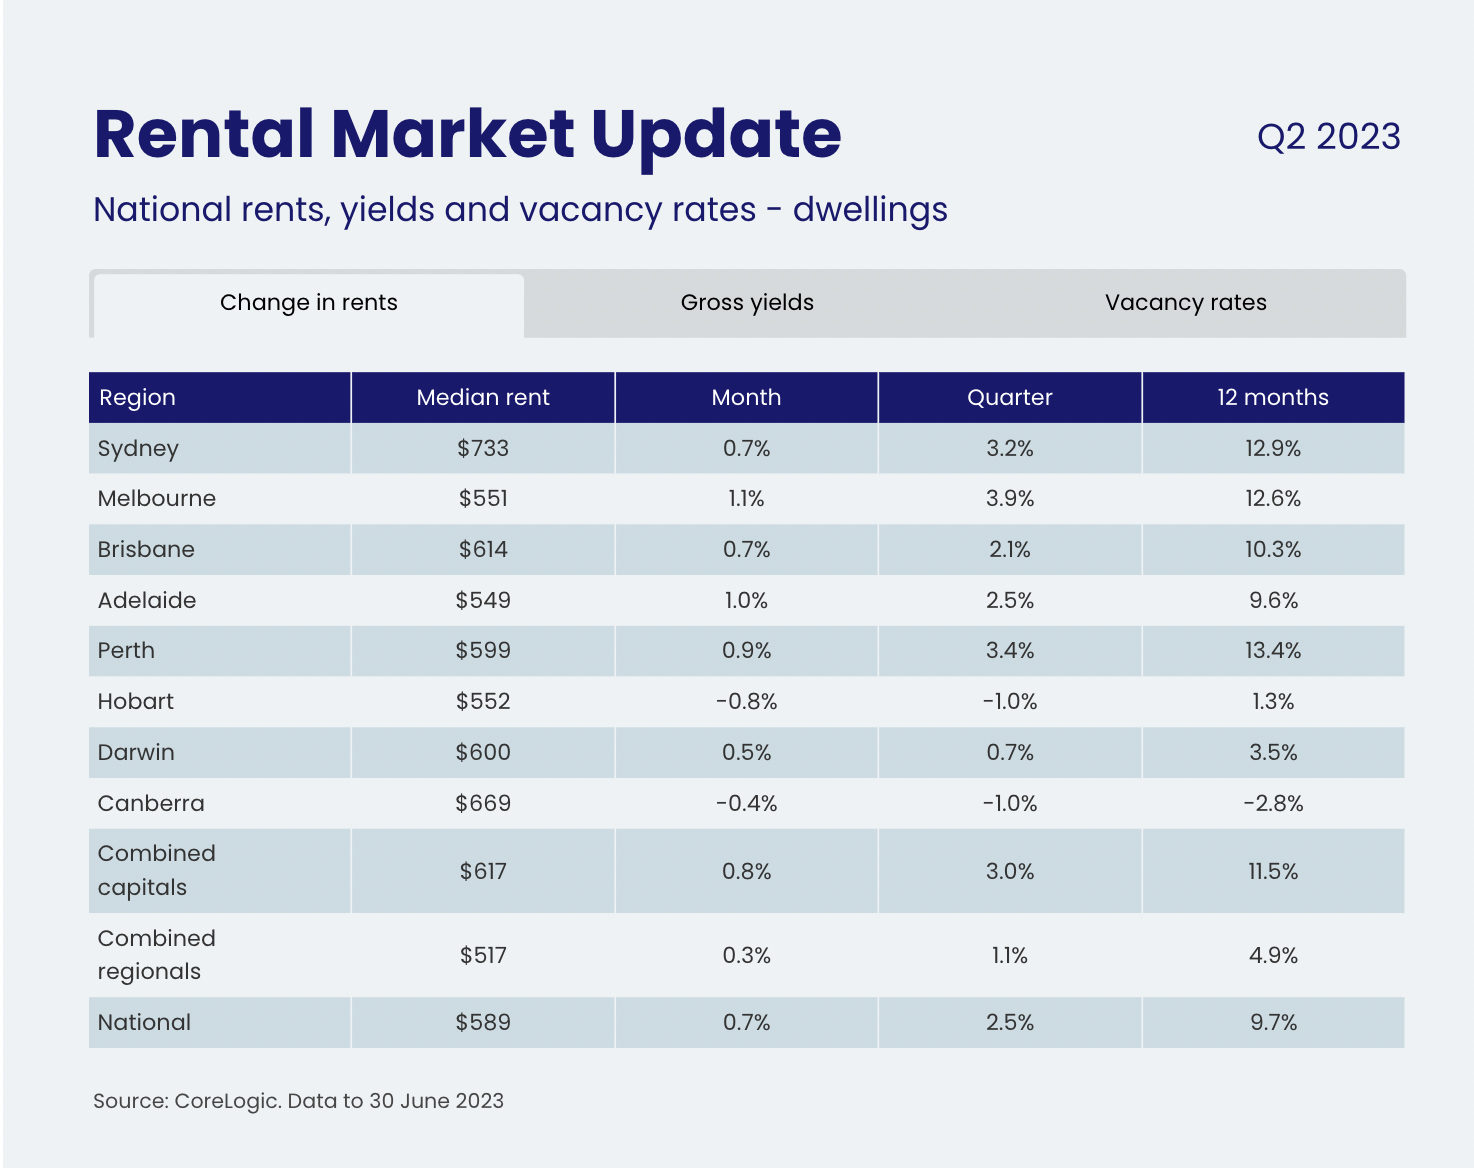
Melbourne continues to lead the pace of quarterly rental growth. As a city, it is a preferred choice for migrants, and historically lower rents than Sydney, with dwelling rents rising 3.9% in the quarter, followed by Perth (3.4%), Sydney (3.2%), Adelaide (2.5%) and Brisbane (2.1%).
“Rents across Darwin rose just 0.7% over the quarter, while both Hobart and Canberra saw rents decline by -1.0%. Adelaide cheapest capital city for rentals
Adelaide has replaced Melbourne as the country's most affordable rental capital, with the typical dwelling renting for $549 p/w compared to $551 p/w in Melbourne.
However, Adelaide could soon lose its new title to Hobart given a gap of just $3/week separates the cities rental markets. Hobart could soon become the country's most affordable rental capital if Adelaide rents continue rising as Hobart rents fall.
Sydney maintained its position as the most expensive capital for the second quarter in a row, with a median weekly rental value of $733.”
Source: CoreLogic Australia Rental Market Report
The Expatriate always tries to make sure all information is accurate. However, when reading our website, please always consider our Disclaimer policy.