

CoreLogic HVI 1st December 2023
Thank you, CoreLogic Australia, for sharing your Home Value Index (HVI) report from the 1st of December that offers insights on the Australia Property Market for November with us. In the report, the HVI rose 0.6%, which is the smallest monthly gain since the upswing in February 2023. Is this the first sign of a double dip after the November Interest rate Rise? Or is it a sign that, finally, there is more stock on the market, and in some capital cities, it is becoming a buyers ’ market? Let’s take a look at the stats.
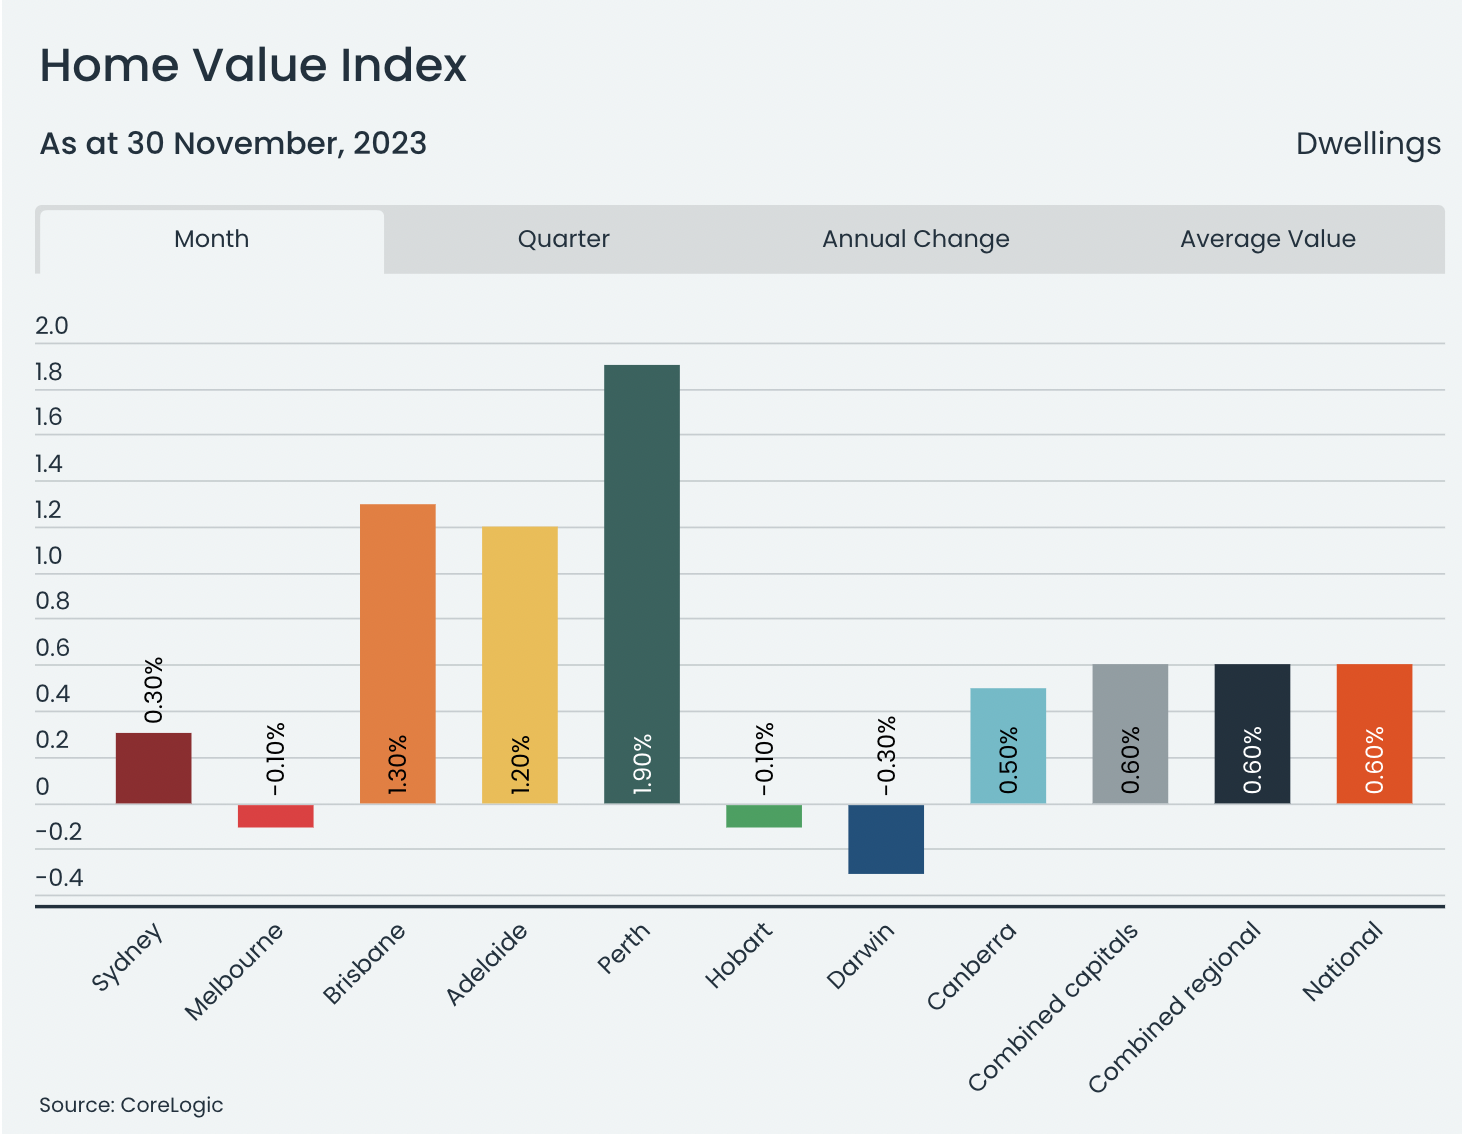
Despite the slowdown, house prices in the country reached a new record high in November. After dropping by 7.5% from the highest point in April 2022 to the lowest in January 2023, home values have increased by 8.3% over the past 10 months, showing a clear recovery. While the overall trends have slowed down, different cities are experiencing varying conditions. In Melbourne and Hobart, house prices declined by 0.1%, while in Darwin, prices went down by 0.3%. Sydney also saw a significant slowdown in house price growth, with an increase of only 0.3%, the smallest gain in the recovery period. The upper quartile experienced the biggest slowdown in growth, which impacted the Melbourne and Sydney markets.
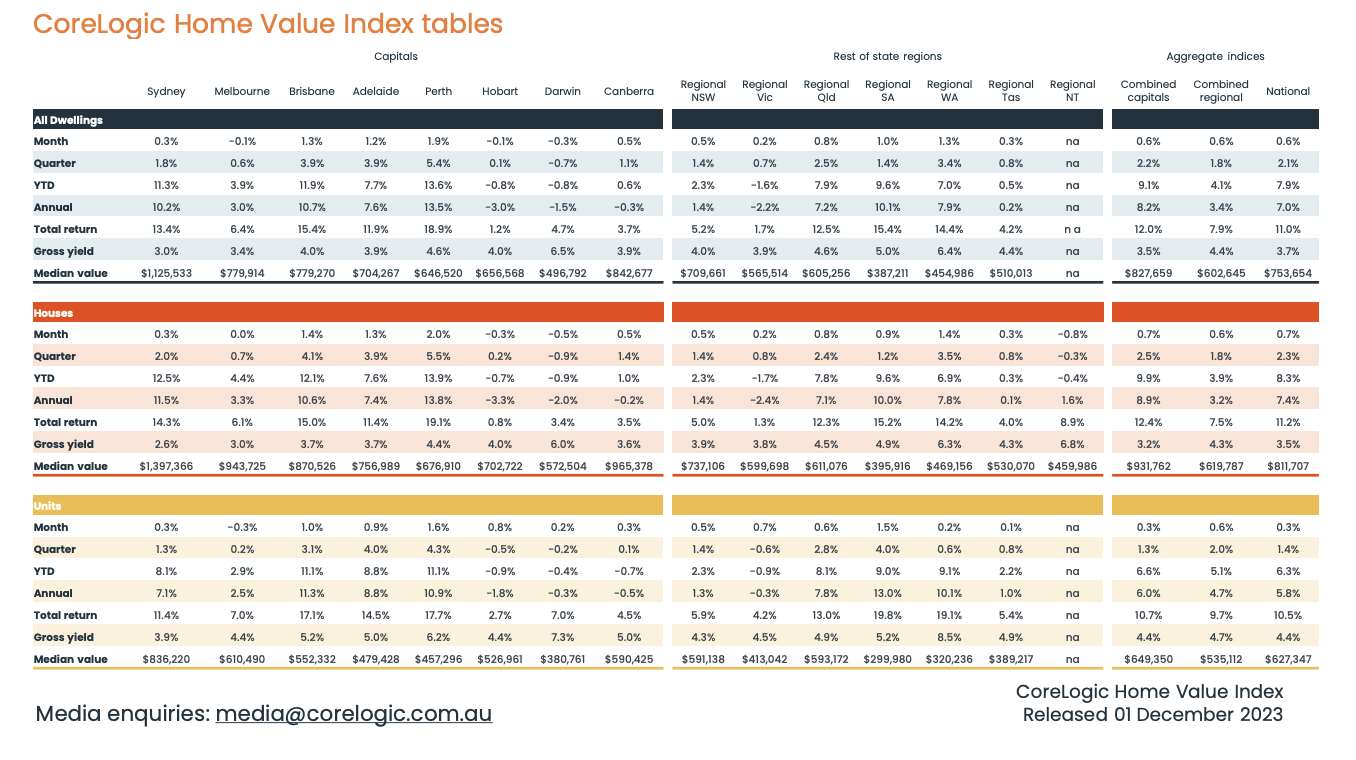
Capital Cities Monthly Change.
Sydney +0.3%
Melbourne -0.1%
Brisbane +1.3%
Adelaide +1.2%
Perth +1.9%
Hobart -0.1%
Darwin -0.3%
Canberra +0.5%
Regional Areas
NSW +0.5
VIC +0.2
QLD +0.8
SA +1.0
WA +1.3%
TAS +0.3%
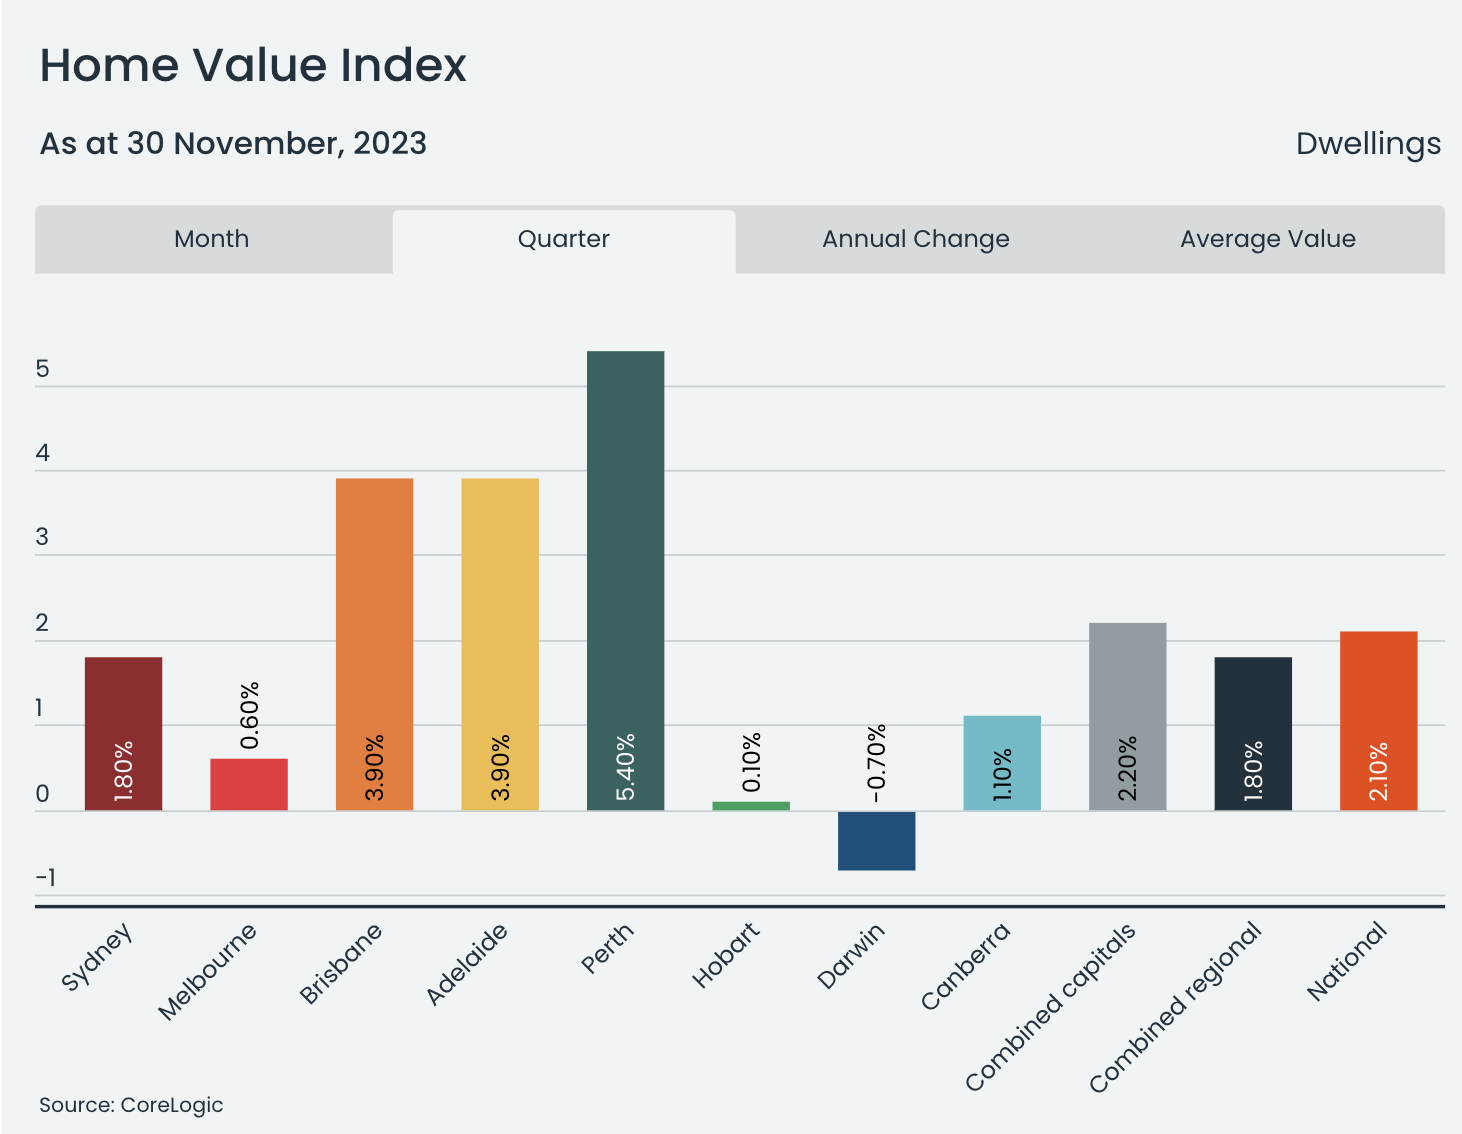
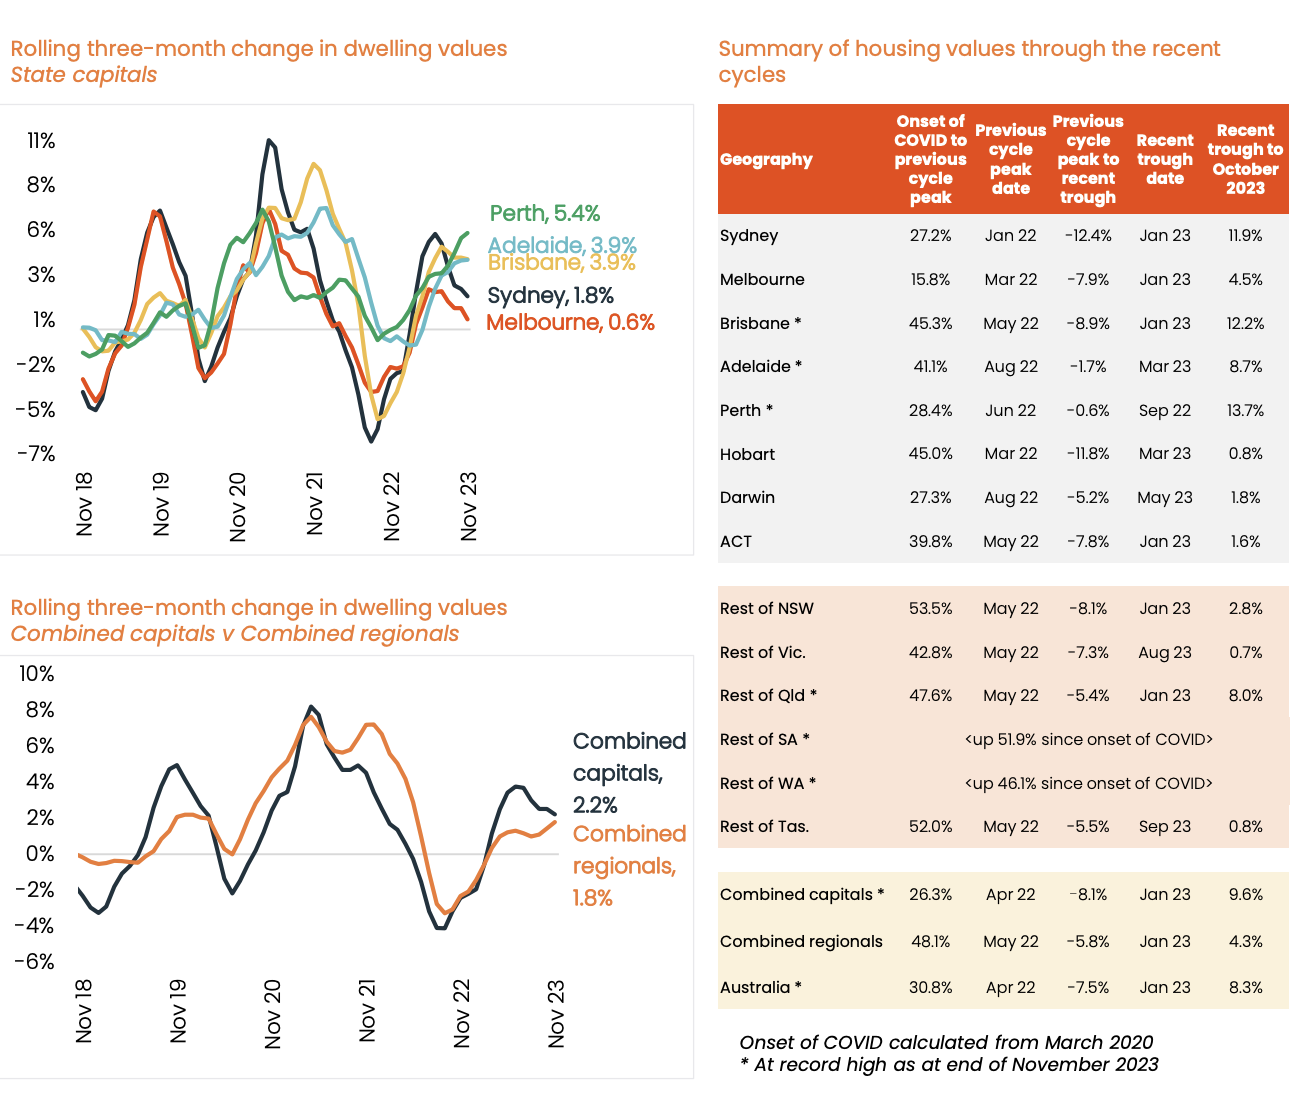
Rolling 3-month change in values State Capitals.
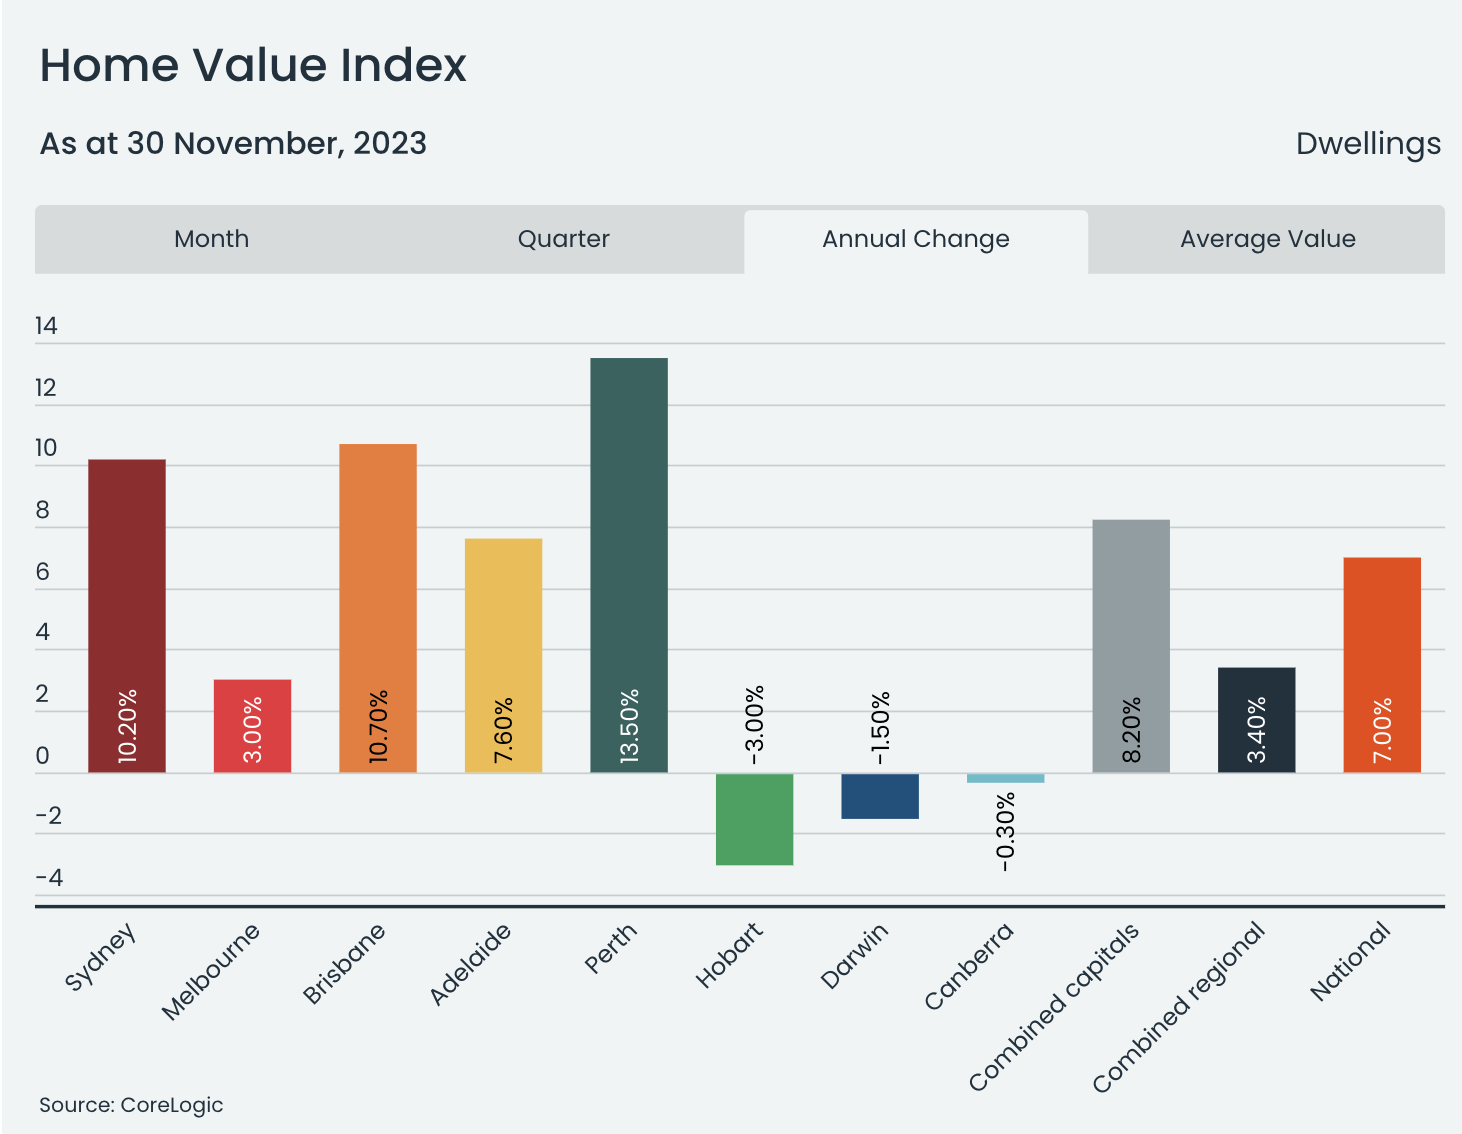
Brisbane, Adelaide, and Perth have experienced record highs since the COVID-19 pandemic and have recovered any losses from their toughs. Is this a sign of a trend to move to more affordable housing yet still be able to find sustainable long-term employment?
Capital Cities
Sydney Trough -12.4% Recovery +11.9%
Melbourne Trough -7.9% Recovery 4.5%
Brisbane Trough -8.9% Recovery +12.2% Record High
Adelaide Trough -1.7% Recovery 8.7% Record High
Perth Trough -0.6% Recovery +13.7% Record High
Hobart Trough -11.8% Recovery +0.8%
Darwin Trough -5.2% Recovery +1.8%
ACT Trough -7.8% Recovery 1.6%
Regional Areas
NSW Trough -8.1% Recovery +2.8%
VIC Trough -7.3% Recovery +0.7%
QLD Trough -5.4% Recovery +8.0%
SA +51.9% Record High
WA +46.1% Record High
TAS Trough -5.5% Recovery 0.8%
“This imbalance between available supply and demonstrated demand is keeping strong upwards pressure on housing values across these markets, despite the downside factors leading to weaker housing market conditions across the lower eastern seaboard,
The Melbourne Cup day rate hike has clearly taken some heat out of the market, but other factors like rising advertised stock levels, worsening affordability and persistently low consumer sentiment are also acting as a drag on value growth in some markets,” Mr Lawless said.
Tim Lawless , Head of Research Asia/Pacific

Across the combined capitals, quarterly sales activity is roughly in line with the previous five-year average, while regional demand is trending modestly higher from below-average levels.
28,330 new listings over the 4 weeks ending 26 Nov, 9.1% above the same time last year and 0.0% below the 5-year average
94,725 active listings over the 4 weeks ending 26 Nov -2.2% below the same time last year -12.9% below 5yr average
Rental markets were very competitive in November, with only 1.0% vacancy rates in capital cities. Adelaide, Perth, and Melbourne have the lowest vacancy rates at 0.3%, 0.6%, and 0.8% respectively. Sydney and Brisbane have rates of 1.2% and 1.3%, which are lower than usual.
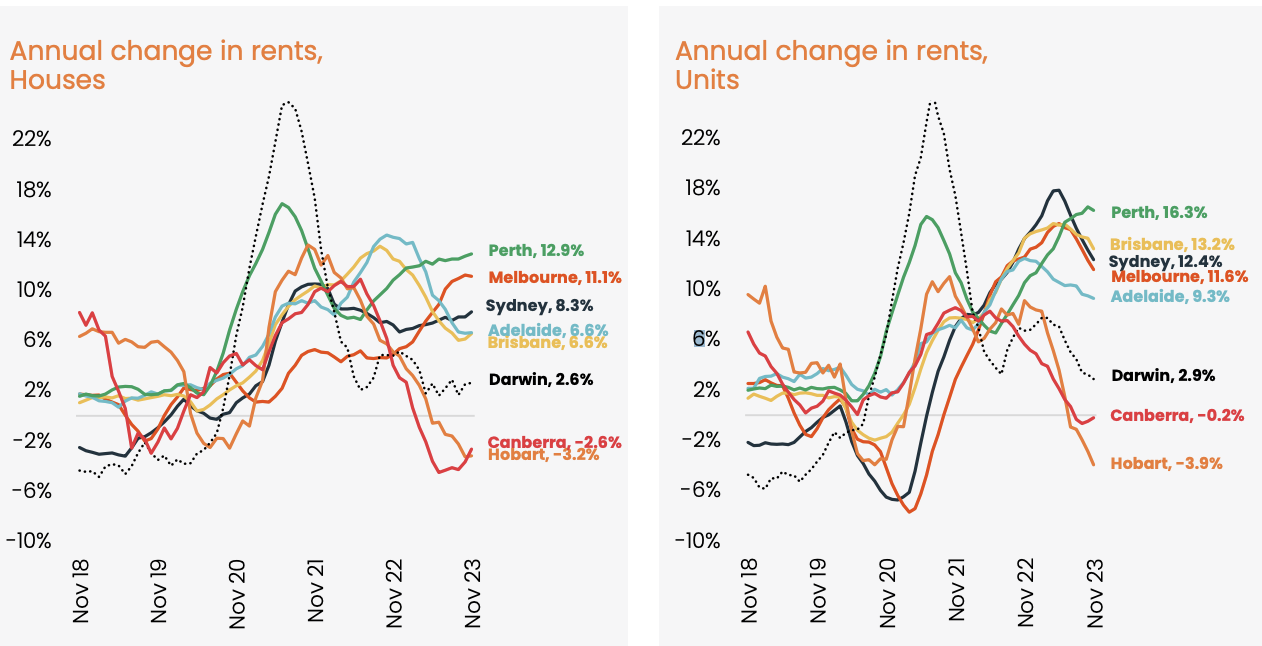
Perth, followed by Sydney, Melbourne and Brisbane, where growth in rental costs is leading the nation. House rents across Perth were up 3.1% over the three months ending November, while unit rents rose even faster, up 3.4%.
“November also marks the first time in six months that rents have increased at a faster rate than home values, providing some support for gross rental yields nationally.”
CoreLogic Australia HVI 1st December 2023.
The vacancy rates in Hobart (1.9%) and Canberra (1.7%) are higher compared to other markets. This means there are more available properties in these cities, which could relieve rental prices for both houses and units.

Tim’s key Takeaways
“The upswing in housing values since February has been relatively thinly traded and occurred against a backdrop of low inventory,” Mr Lawless said. “The factors that have supported value growth are losing their potency, with advertised stock levels rising to above average levels in some cities.”
“The lower than expected monthly inflation outcome for October may help to allay fears of further rate hikes and lift consumer spirits a little, but the risk of another increase in the cash rate remains. We don’t expect to see a material lift in housing activity until interest rates reduce, and that isn’t likely until the second half of next year,” Mr Lawless said
Downside risk factors have become more pronounced, including an expectation that interest rates could remain higher for longer, worsening affordability challenges, and deeply pessimistic levels of consumer sentiment look to be entrenched.
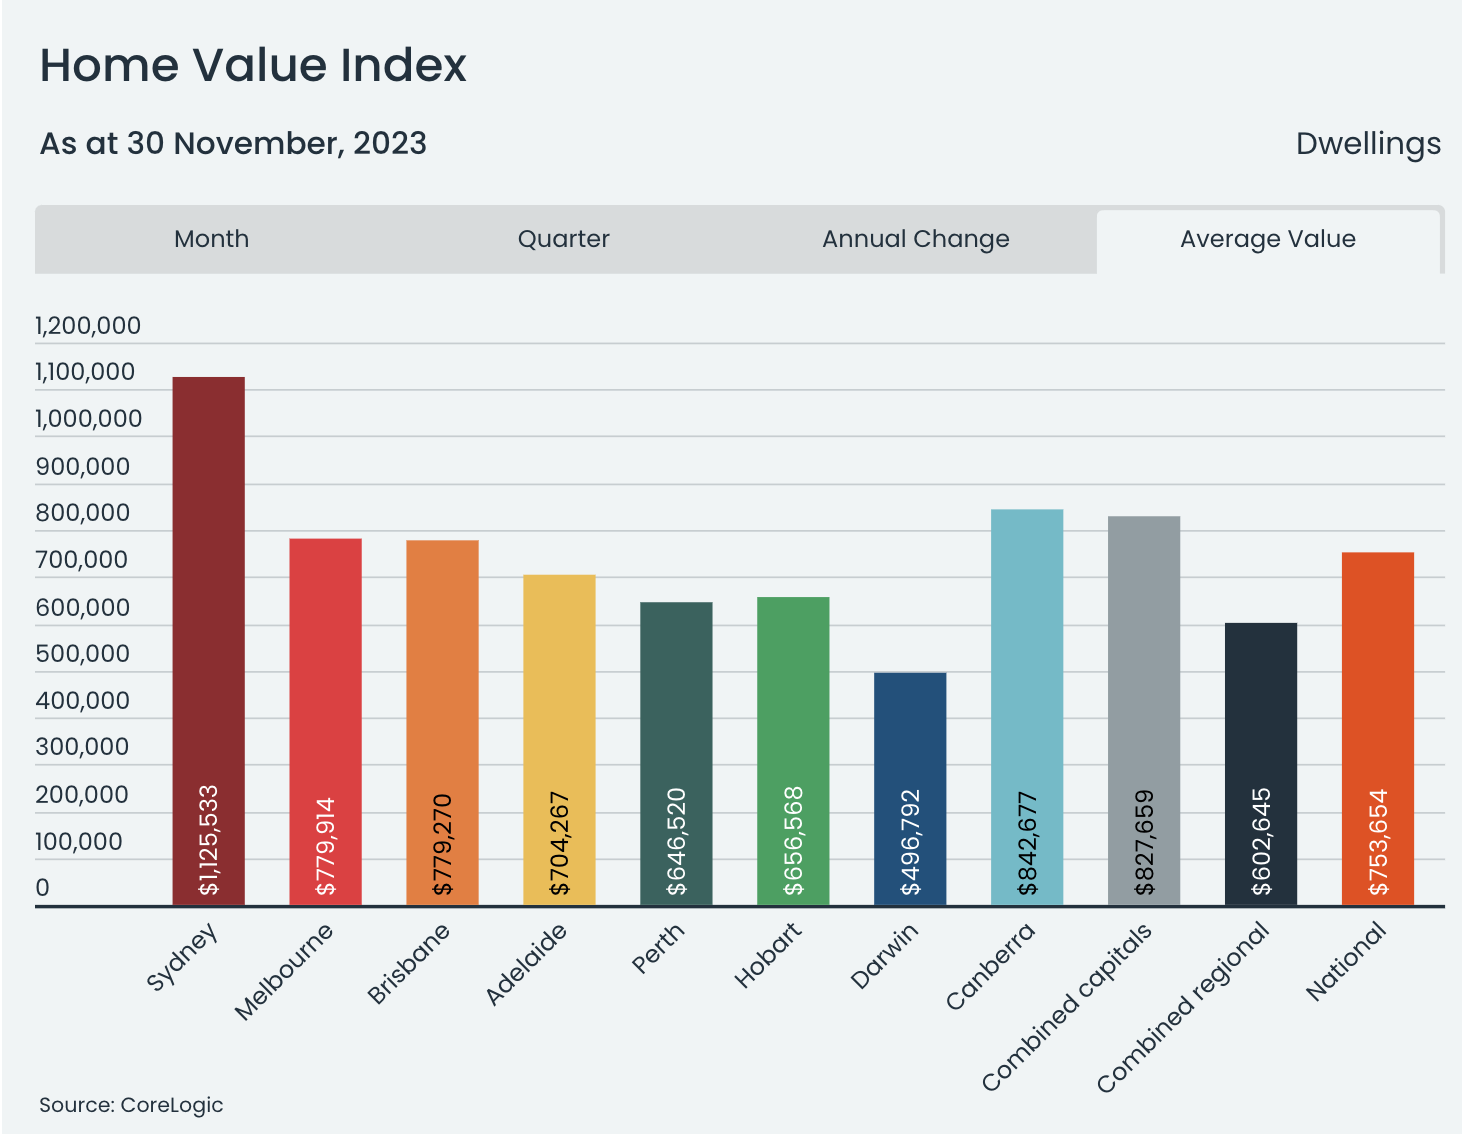
Adding further downside risk to housing activity is a worsening in housing affordability. The median dwelling value to income ratio rose to 7.5, the portion of household income required to service a new mortgage is close to record highs at 46.2%, it now takes an average of 10 years to save a 20% deposit, and the portion of household income dedicated to rental payments has risen to 31.0%
2024 is shaping up to be a very different housing market, with expectations that value growth will be lower and more diverse from region to region and across housing types. A few trends to watch for next year:
A focused effort on delivering more supply to the Australian housing market. The government, policymakers and industry widely acknowledge a burgeoning housing undersupply as a critical issue. With dwelling approvals holding well below average levels in 2023, it’s likely new housing starts will also remain low, despite the national objective of delivering 1.2 million well-located homes by 2029.
Rental conditions are set to loosen. It’s likely we are moving through a peak in net overseas migration, but other factors should see vacancy rates rise and rental growth slow further, including a gradual normalisation in household size and reduced rental demand as ‘HomeBuilder’ completions flow through. Build-to-rent developments should also help to gradually add to the rental supply, however, we aren’t likely to see a material increase in built-to-rent supply until at least 2025
Growth in housing values is likely to show greater diversity, both geographically and across housing types. We are already seeing a trend towards a stabilisation or even softening in capital growth in some cities. Overall, housing value performance is likely to be softer next year relative to 2023. WA and Queensland look well placed to outperform the rest of the country given solid interstate migration rates, low supply and less affordability challenges relative to Sydney and Melbourne. Unit values also are positioned to outperform relative to houses, given the cheaper price points and burgeoning undersupply across the medium to high-density sector.
Climate change to be high on the housing policy agenda. With residential dwellings accounting for around 23% of Australia's energy usage and 11% of carbon emissions, policies aimed at reducing or improving the energy efficiency of Australian homes are likely to be a key area of focus for politicians, policymakers and the residential construction sector more broadly. Additionally, El Nino conditions are expected for 2024, which implies drier conditions and warmer temperatures. The risk of fire danger and drought are likely to be heightened in susceptible regions.
To read the full report with data on best performing suburbs click on the link below.
The Expatriate always tries to make sure all information is accurate. However, when reading our website, please always consider our Disclaimer policy.